RESET® Air Index
The RESET Air Index is an index for communicating indoor environment quality based on concentrations of multiple types of pollutants, including PM2.5, CO2, and TVOC. Unlike AQI, which only reflects the worst pollutant, the RESET Air Index is designed to reflect all pollutants.
1. What is the RESET Air Index
RESET Air provides a tangible return on investment for offices and property owners. For offices, RESET Air enables healthier spaces and more productive spaces. For property owners, RESET Air empowers the communication of healthier, more productive buildings to prospective tenants.
2. Intent of the RESET Air Index
The RESET Air Index communicates indoor environment quality based on concentrations of multiple types of pollutant.
The RESET Air Index's intent is to tackle the following:
Takes into consideration multiple indicators and their impact to the air quality
Unlike AQI, which only reflects the worst pollutant indicator, the RESET Air Index reflects all indicators.
Takes into account the cumulative effect of pollutants in the air
A single pollutant with high concentration causes more harm to human health than several low concentration pollutants. The RESET Air Index rates the sum of concentrations where a the single pollutant is at higher concentrations more harmful than if there are multiple lower concentration pollutants.
Leverages the Performance Targets of the RESET Air Standard
The RESET Air Index takes consideration the performance targets set by the RESET Air Standard, where if concentration of air quality indicators meets the targets as set by the RESET Air Standard, the RESET Air Index decreases slowly when concentration increases. But once the concentration for the indicators fail to meet the performance targets in the standard, the RESET Air Index will start to drop quickly.
Flexibility for Additional Indicators
The methodology is flexible to allow for the inclusion of additional indicators, with a maximum number of 10 without any further adjustments needed.
Easy Communication with Percentile Display
The RESET Air Index is displayed in percentile, which makes it easy to communicate good vs. bad with the best score being 100%.
3. RESET Air Index Algorithm
More information coming soon.
Step 1 - Collect Data
Collect the monitored data of the different pollutant indicators: PM2.5, CO2, TVOC.The data can be the most recent reading, an average over 30 minutes, an average over a day, or even an average from multiple monitors, as long as it is consistent for all the indicators.
This will help us collect the concentration reading of the indicators: Ci.
Step 2 - Calculate Points Lost
The algorithm attributes points lost to the RESET Air Index for each indicator based on the concentration.
For each Ci, we calculate the points lost, li, using piecewise linear function:

where:
- li = the number of points lost due to the indicator.
- Ci = the concentration of the indicator.
- Clow = the breakpoint value right below Ci and Llow is the corresponding point lost value.
- Chigh = the breakpoint value right above and Lhigh is the corresponding point lost value.
The breakpoints for the different indicators can be found below:
For PM2.5 (ug/m3):
| Clow | Chigh | Llow | Lhigh |
| 0 | 15 | 0 | 0 |
| 15 | 35 | 0 | 11.5 |
| 35 | 120 | 11.5 | 100 |
For TVOC (ug/m3):
| Clow | Chigh | Llow | Lhigh |
| 0 | 200 | 0 | 0 |
| 200 | 500 | 0 | 11.5 |
| 500 | 1000 | 11.5 | 100 |
For CO2 (ppm):
| Clow | Chigh | Llow | Lhigh |
| 0 | 600 | 0 | 0 |
| 600 | 800 | 0 | 11.5 |
| 800 | 2500 | 11.5 | 100 |
Step 3 - Add up the total points lost
Add up the total points loss of each indicator. Calculate the total points lost, L, using p-norm as below:
Let l = (l1, l1,..., ln)

where p = 2
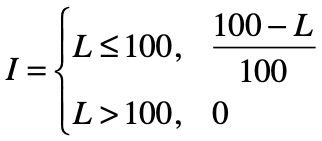
Step 4 - Inverse the Result
Take the total points loss and subtract it from 100 to get the RESET Air Index, I:

I should be displayed as a percent.
4. Example Scenarios
Below are a couple scenarios and the corresponding RESET Air Index:
Scenarios where the RESET Air Index is 90%:
| PM2.5 (ug/m3) | TVOC (ug/m3) | CO2 (ppm) | RESET Air Index |
| 32 | 200 | 600 | 90% |
| 25 | 300 | 700 | 90% |
Scenarios where the RESET Air Index is 80%:
| PM2.5 (ug/m3) | TVOC (ug/m3) | CO2 (ppm) | RESET Air Index |
| 43 | 200 | 600 | 80% |
| 35 | 500 | 800 | 80% |
Scenarios where the RESET Air Index is 70%:
| PM2.5 (ug/m3) | TVOC (ug/m3) | CO2 (ppm) | RESET Air Index |
| 52 | 200 | 600 | 70% |
| 40 | 530 | 920 | 70% |
5. Performance Categories
Recommended labels and colors to be used with the RESET Air Index:
| Label / Color | RESET Air Index |
| Green | 90% or higher |
| Yellow | 80-89% |
| Orange | 65%-79% |
| Red | 50-64% |
| Purple | 49% or lower |