
Indoor Air Quality Monitoring for the GIGA Shanghai Office
A look into the considerations for how monitors were installed in the office and what we learned from the data.
The following is a case study on how the GIGA Shanghai Office approached indoor air quality monitoring according to the RESET Air Standard.
The project is located in Shanghai and renovations were competed in 2015, while monitoring was installed in 2018.
Initial Design
The GIGA Shanghai Office, designed by A00 Architecture, consists of an open office floor plan with a semi wall divider in the middle and two conference rooms in the back.
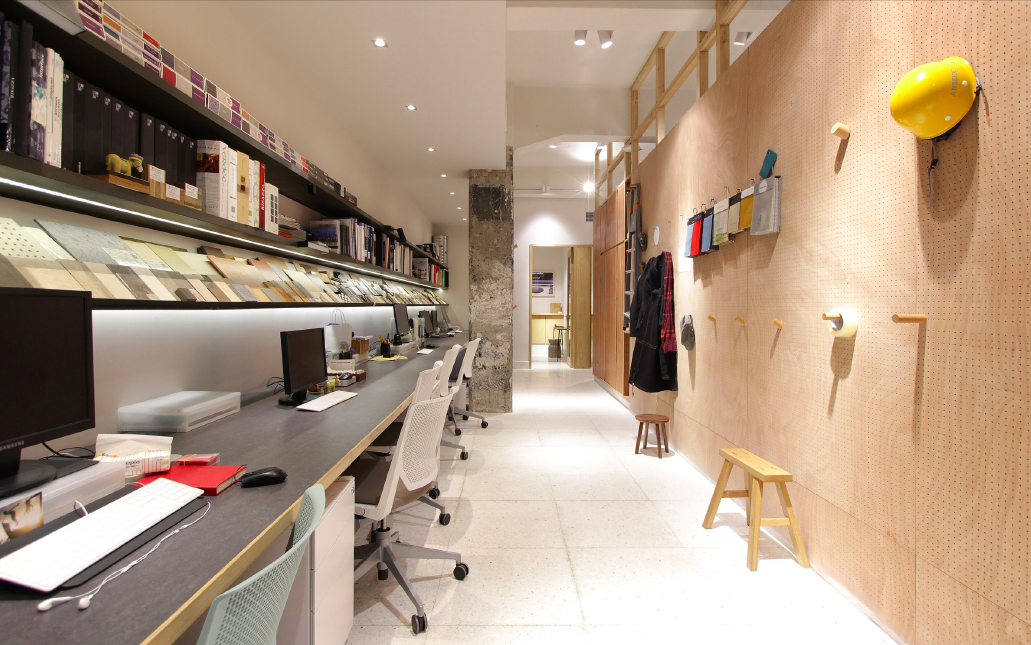
Figure 1: The open office area.
At just 105 m2, only two indoor air quality monitors were needed to fulfill the RESET Air requirements: one in the open office and the other in a conference room to cover all space types.
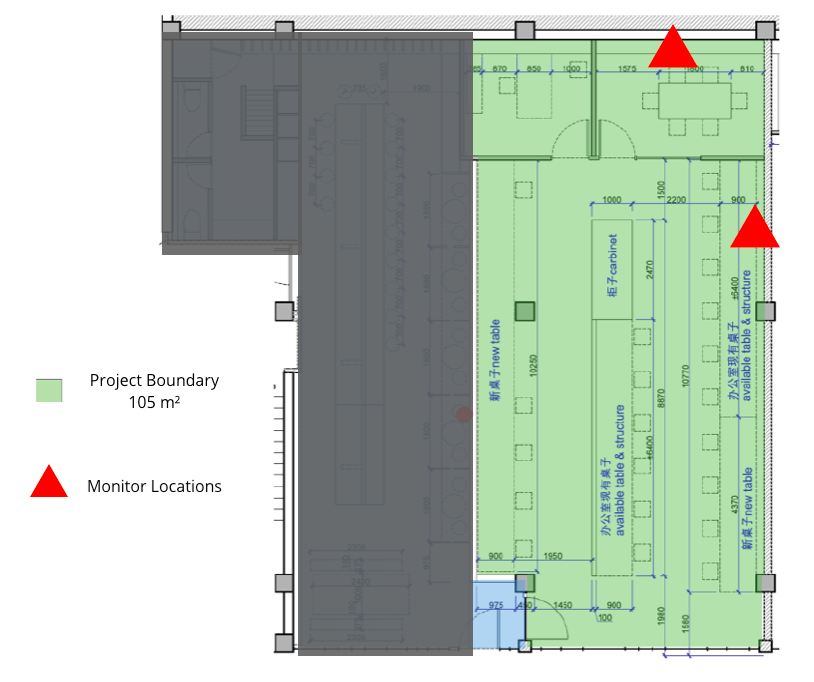
Figure 2: Project Boundary and Monitor Deployment Plans
The space is directly connected to a public facing cafe where coffee and cakes are served. As the space is operated separately, the cafe area is not included in the project boundary.

Figure 3: Cafe area.
Monitor Installation and Setup
For monitor installation, Pure Living China helped with sourcing and installation of two DST Breathforce Nanos.
One was installed on the wall of the conference room to measure air quality during meetings.
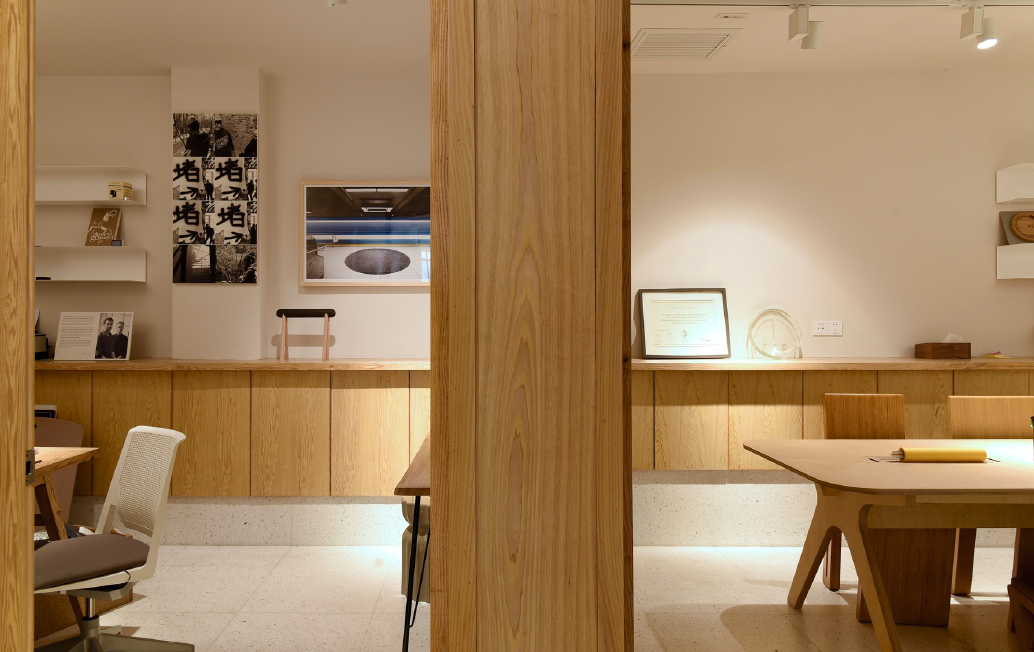
Figure 4: Conference Rooms.
And the other one was installed in the open office area, both installed at the height of the breathing zone (between 0.9m and 1.8m).
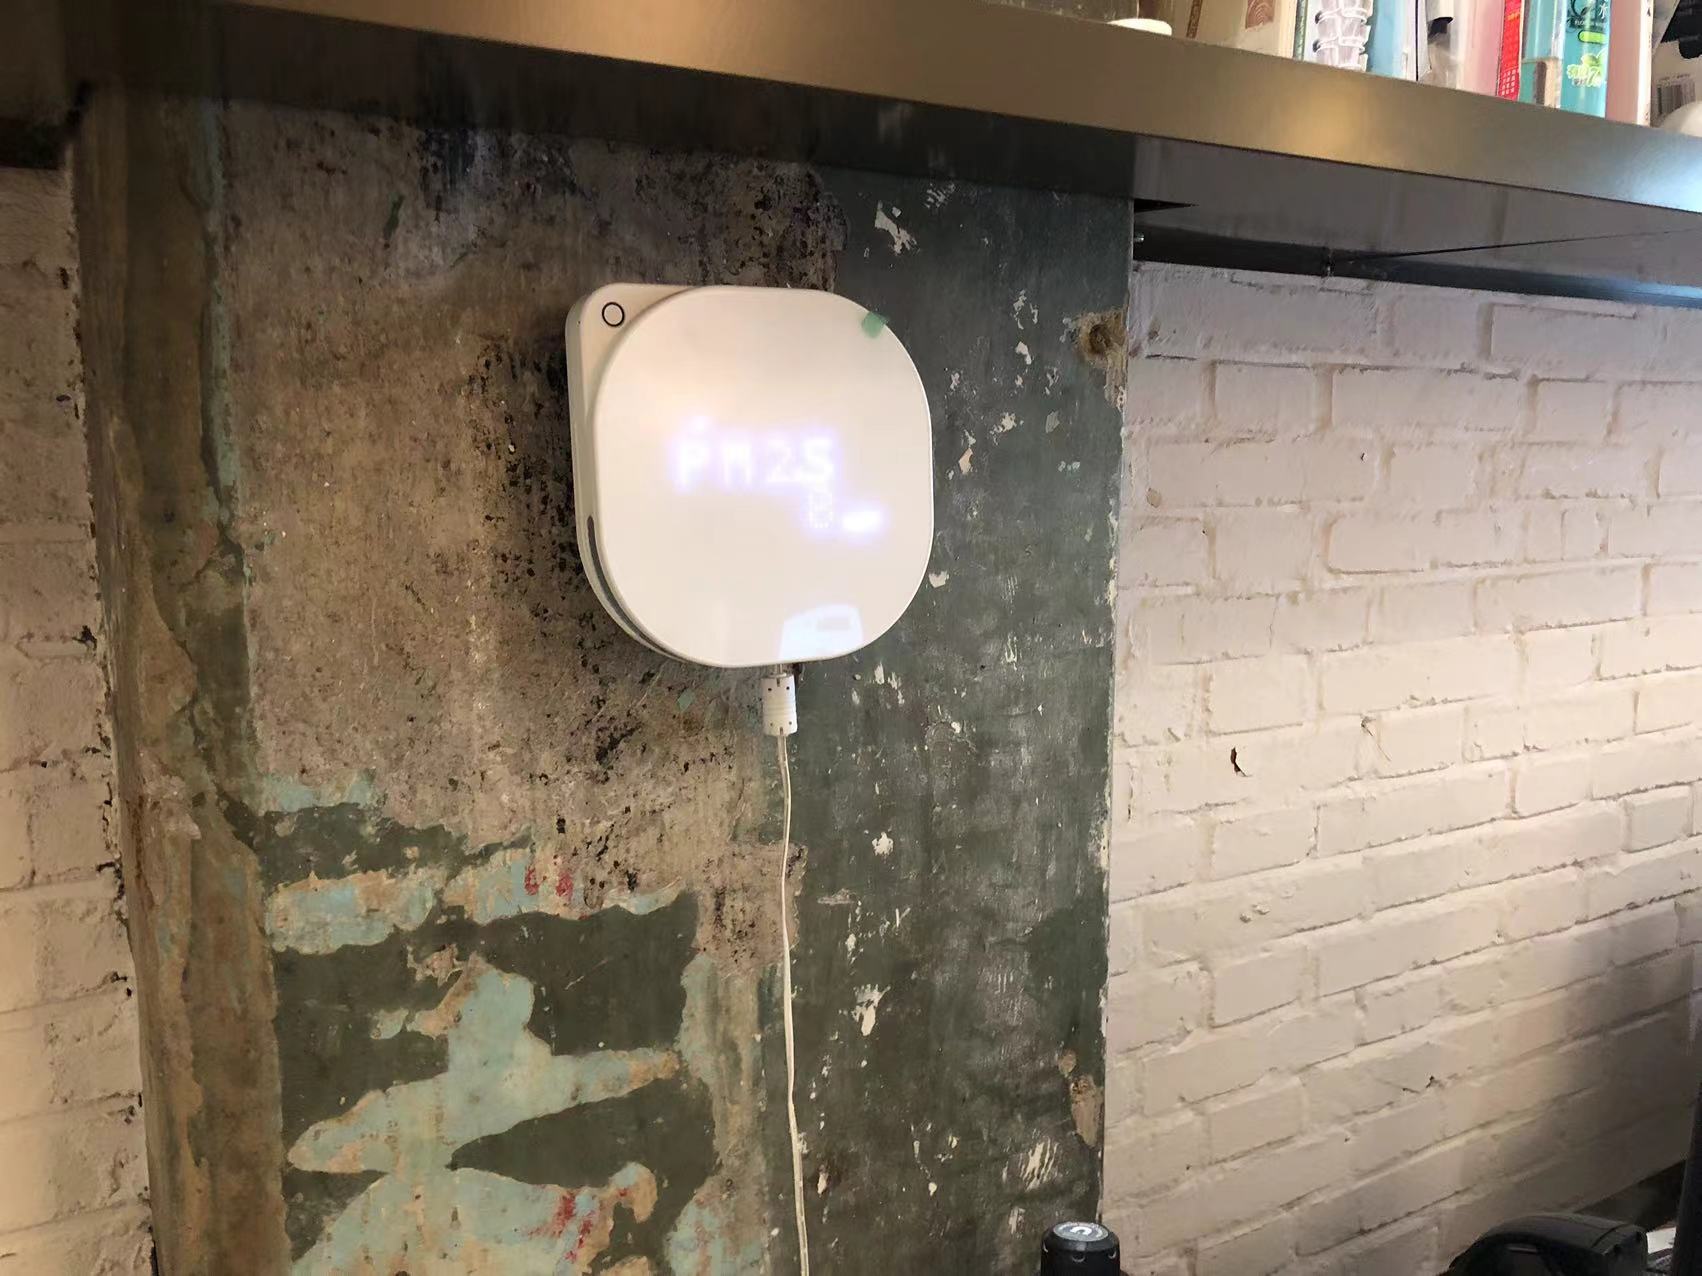
Figure 5: Monitor Installation.
The monitors installed all have screens on them that rotate through the different air quality parameters (PM2.5, CO2, TVOC, Temperature, and Relative Humidity).
Data Analysis and Learnings
Due to the fact that the HVAC system was designed and installed before we had continuous indoor air quality monitoring installed, the indoor air quality in our office is not perfect. The system is also currently not fully automated by leveraging indoor air quality data, so any change to the system settings would need to be performed manually.

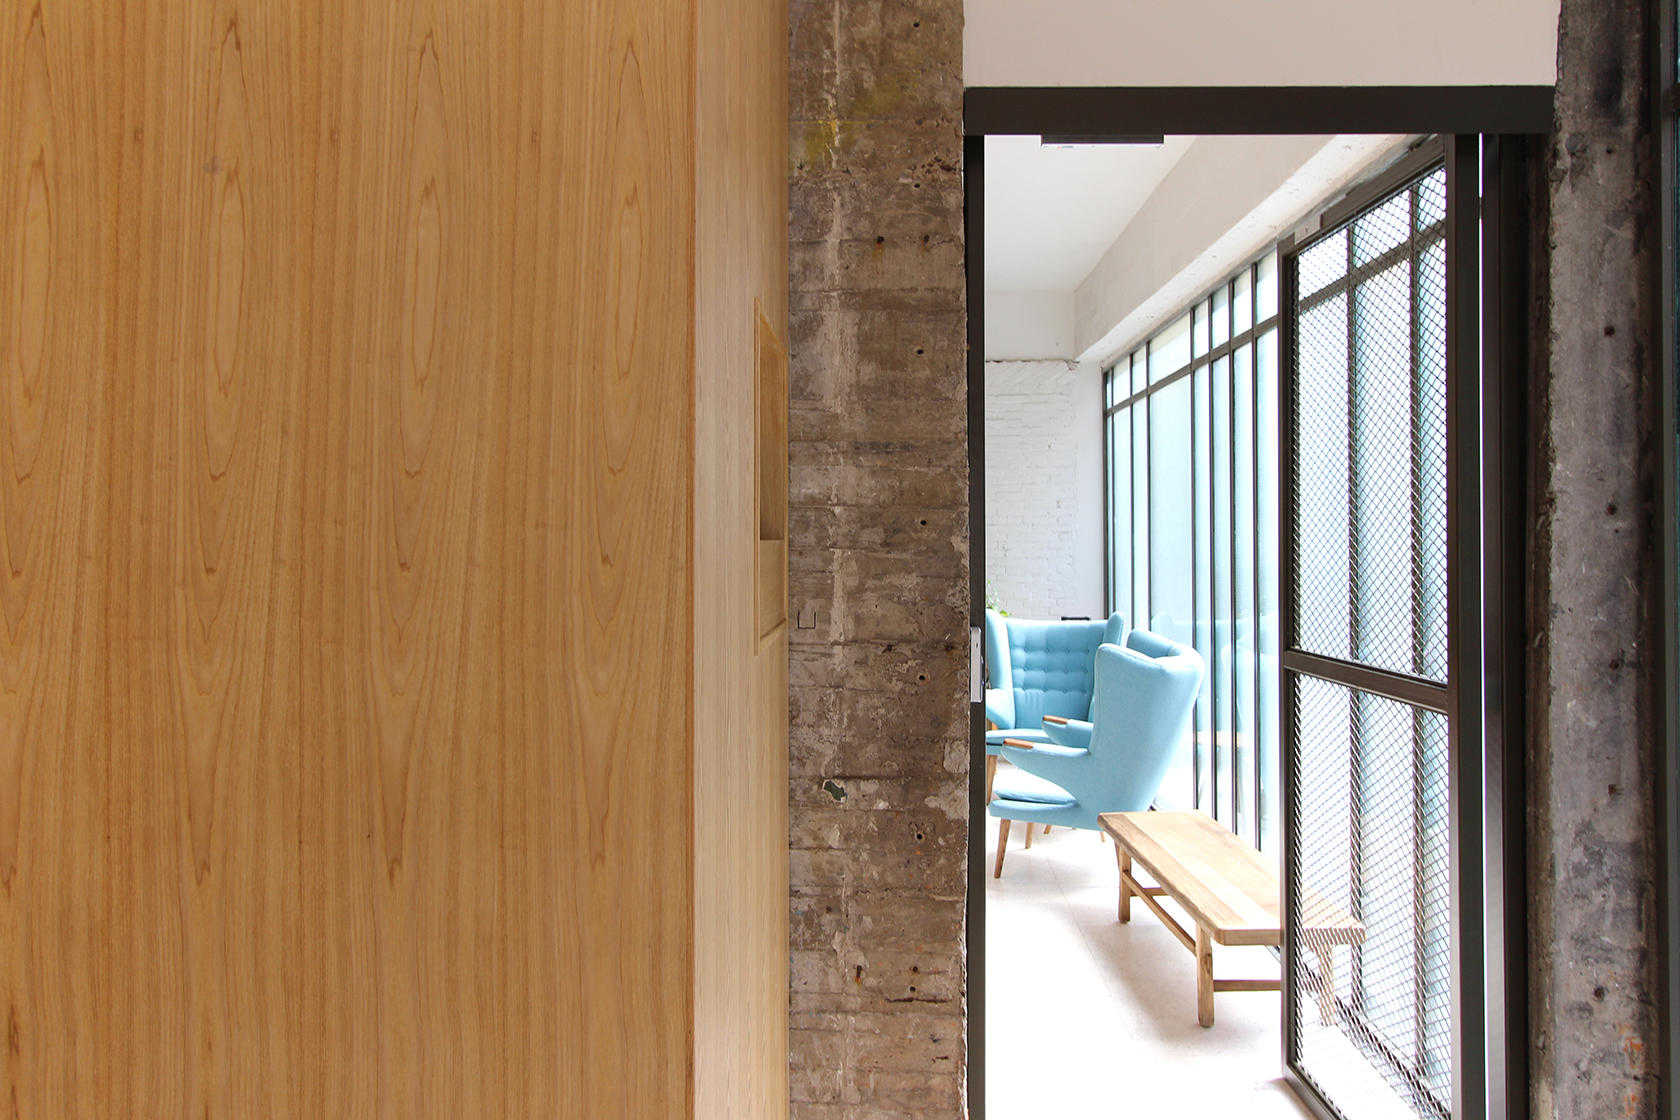
Figure 6: Office entrance.
As indoor air quality is displayed live in the office via the screens on the monitors themselves, the occupants in the office are very familiar with seeing the data and use it to help them make decisions pertaining to indoor air quality.
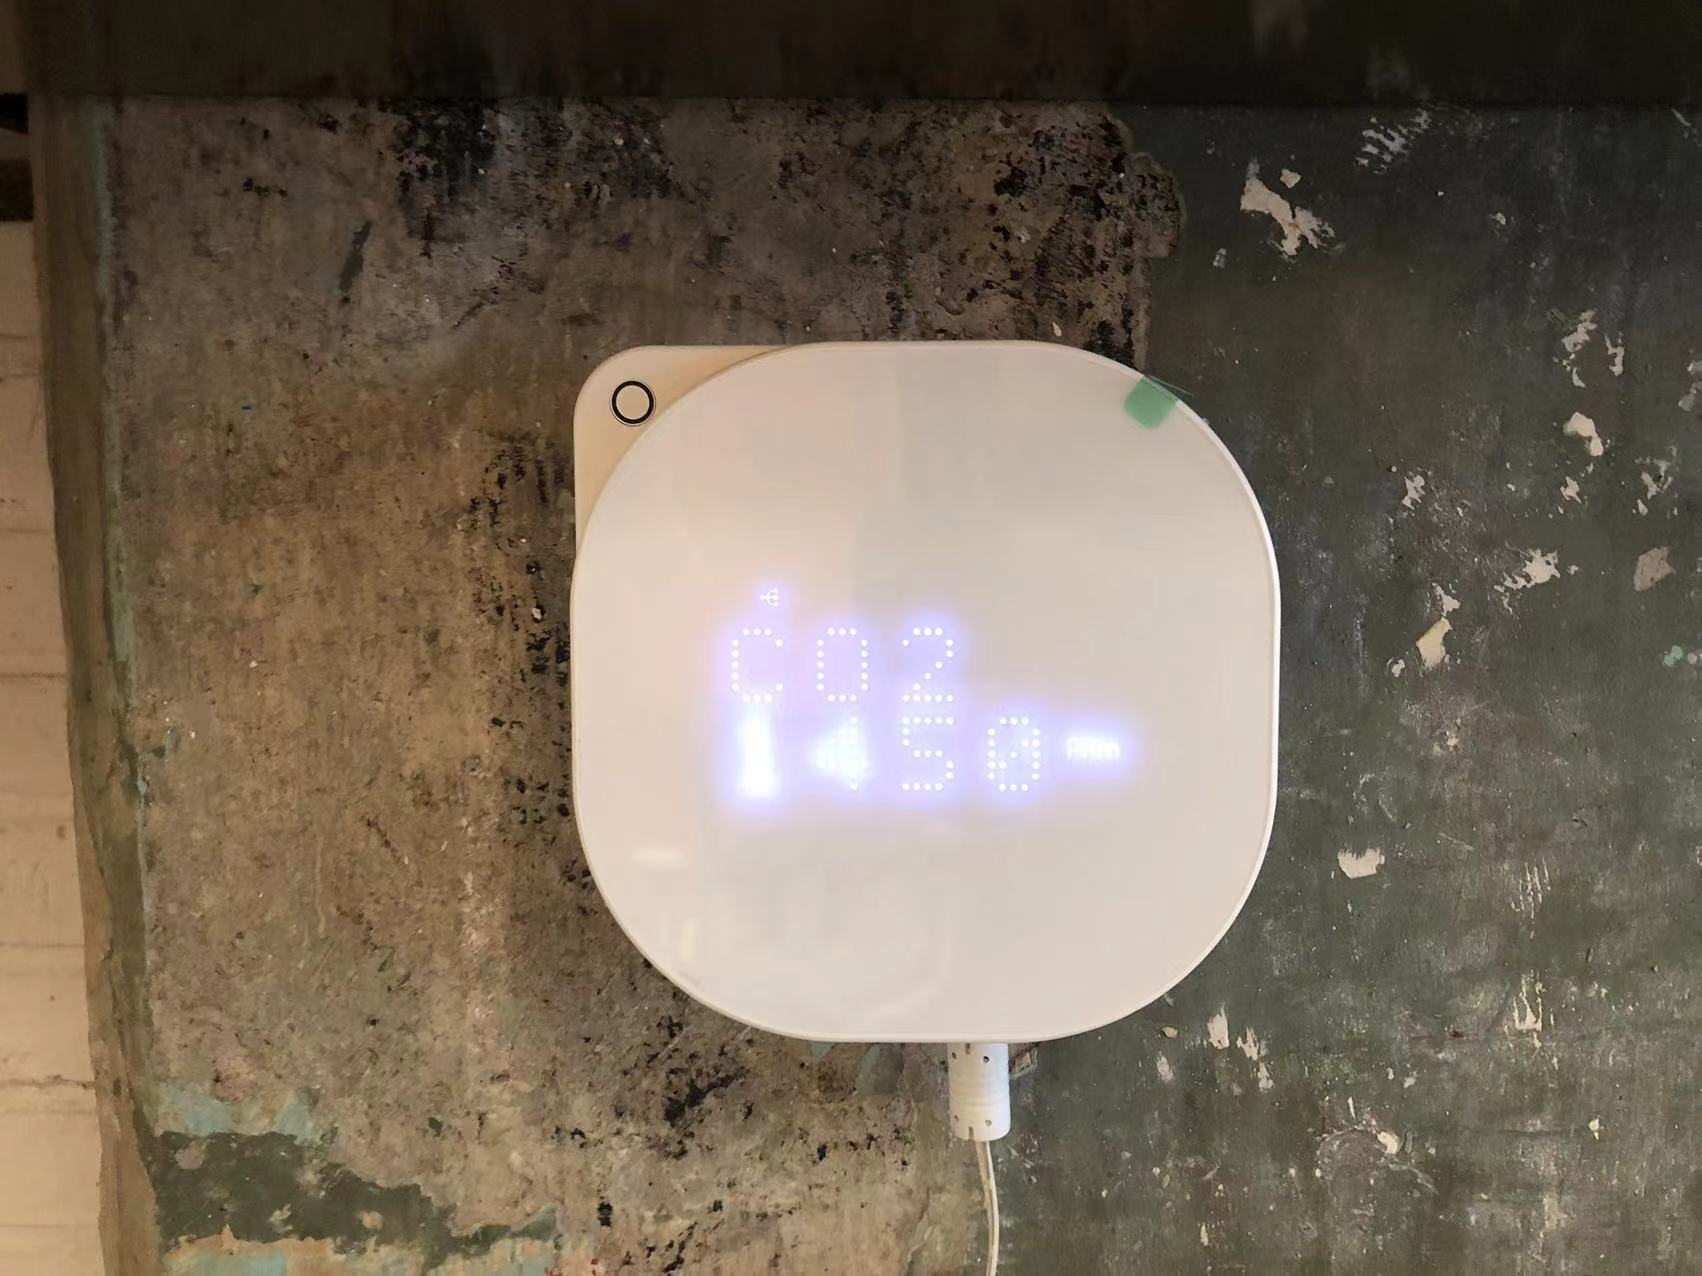
Figure 7: Live readings displayed on the IAQ monitor.
For example, when CO2 numbers are high, the fresh air system will be turned on higher. There will also be considerations for keeping the front door and back door open to create a draft of fresh air, which only makes sense if the outdoor air quality is good.
For longer term analysis and patterns, we use QLEAR to store, display, and submit data to the RESET Cloud for RESET Air Project Accreditation.
PM2.5 Analysis
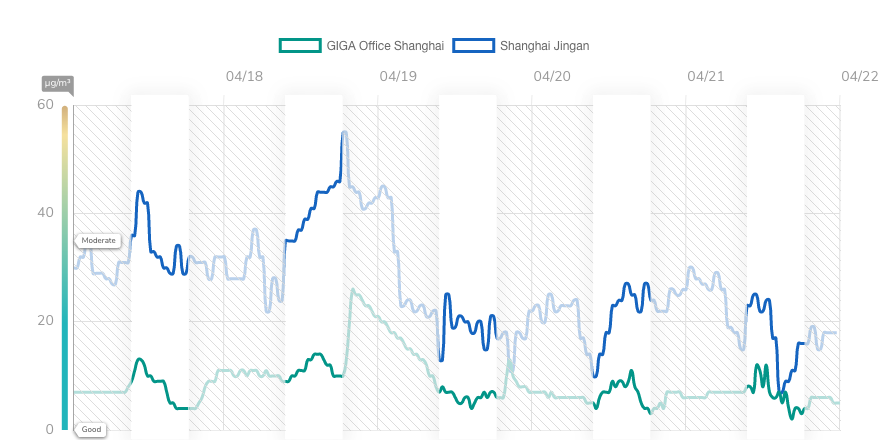
Here is an example of PM2.5 data over the week of 2023.04.17 to 2023.04.22, including outdoor and indoor data. During working hours, indoor air quality is always below 15 ug/m3 as the indoor filtration is running. The spike upwards as thhe evening starts on 2023.04.18 is the result of the front and back doors being open to bring in fresh air.
CO2 Analysis
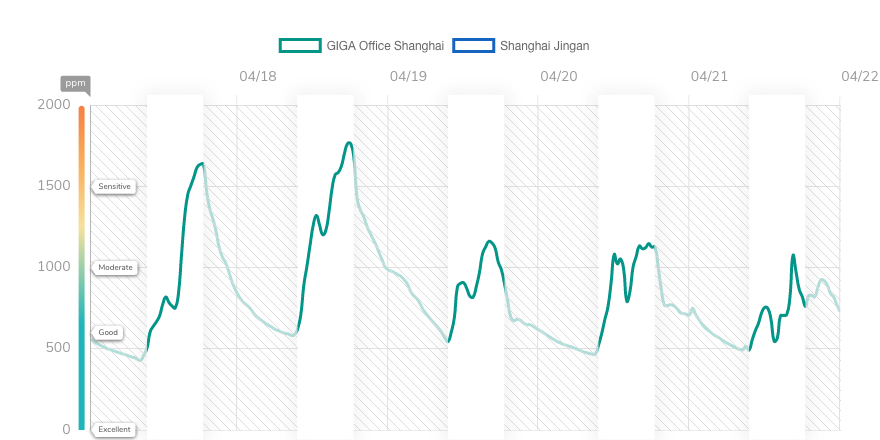
The fresh air system in the space does fall short of maintaining the best indoor air quality. Especially when the cafe fills up, CO2 will go up significantly and can easily surpass 1500 ppm. If the weather allows and outdoor air quality is good, keeping the doors open can keep CO2 levels very low.
TVOC Analysis
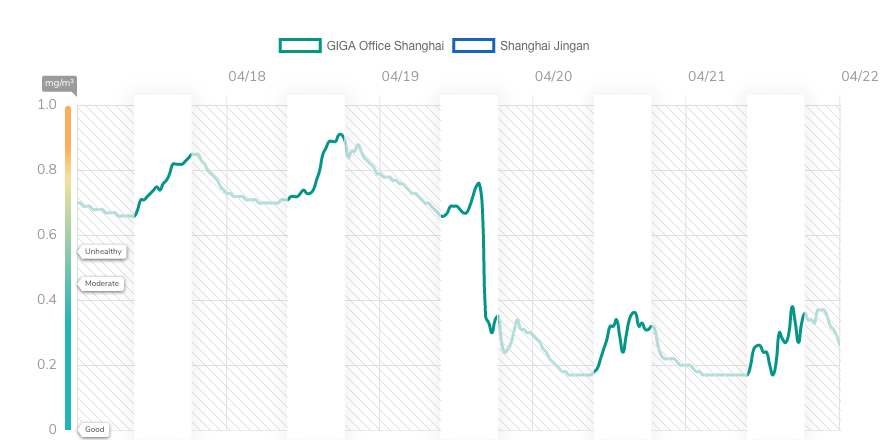
TVOC during this week was really high. It was discovered that there was a piece of sample furniture in the office (the office is shared with an interior design firm) that was off-gassing. Once the piece of sample furniture was removed, TVOC levels went back down again.
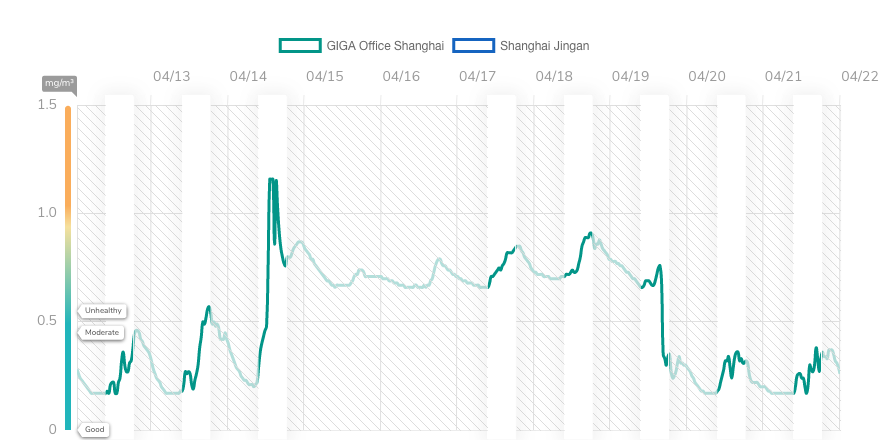
Zooming out to two weeks, we can see the exact date when the sample piece of furniture was moved into the office and when it left the office.
Conclusion
Continuous indoor air quality monitoring has helped us maintain better air quality in our office environment. Even though it is not automated, thanks to the visibility of the data, we have built enough awareness and understanding around indoor air quality with the team in the office that most people will know what manual actions should be taken.
As we also do monitor testing in this office, it is actually a blessing in disguise as we have a myriad of different indoor air quality situations that are generated by the normal usage of the space.